
If you look at the recent Solana chart, it’s a part that many people are worried about.
It’s important to decide if this is the bottom or if it’s going to fall further.
Based on the chart flow below, I’ll just summarize the key points.
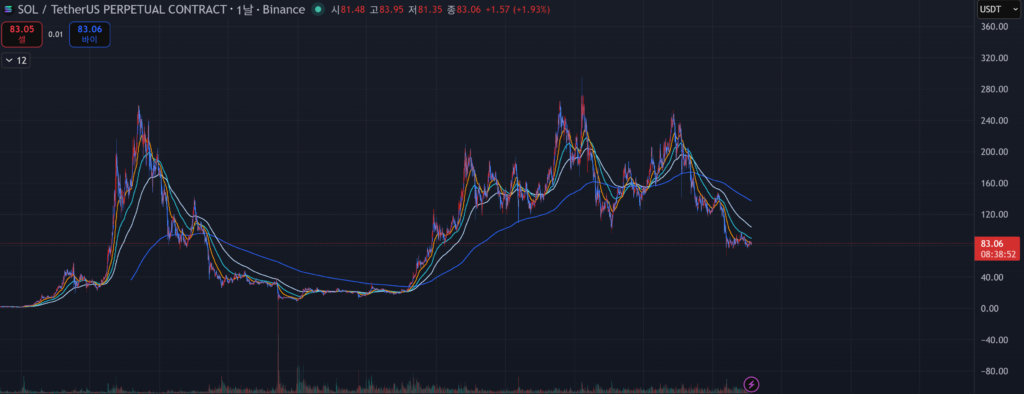
Current price – $82 range
If you look at the first chart, the current price is around $82.
This segment is significantly more pressed than previous gains, but there is still a lack of trend-shifting signals. That means it may look cheap, but it’s still hard to see as a “solid bottom.”
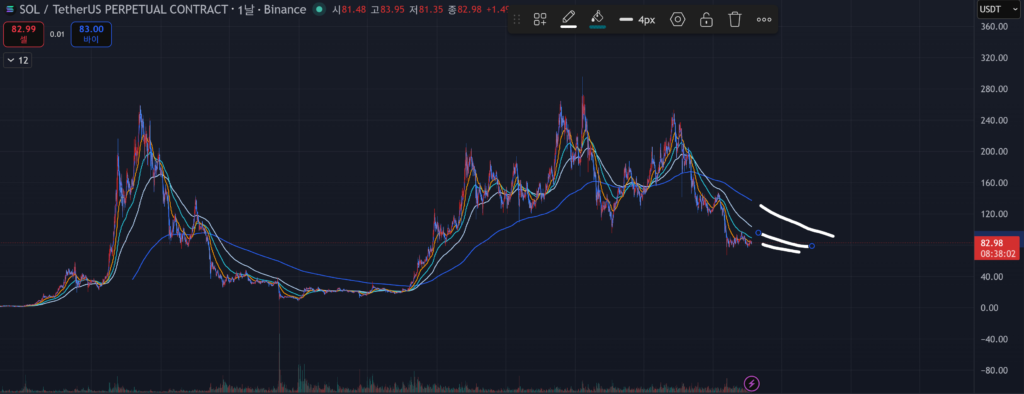
It’s the 2nd chart
The key is this level and you can see that the downtrend is still going on
These flat lines do not converge and remain open
This is an important signal.
Only when this level converges will it be ready to turn around and then it will diverge and the trend will continue. In other words, the current situation is likely that the downward trend is not over yet.
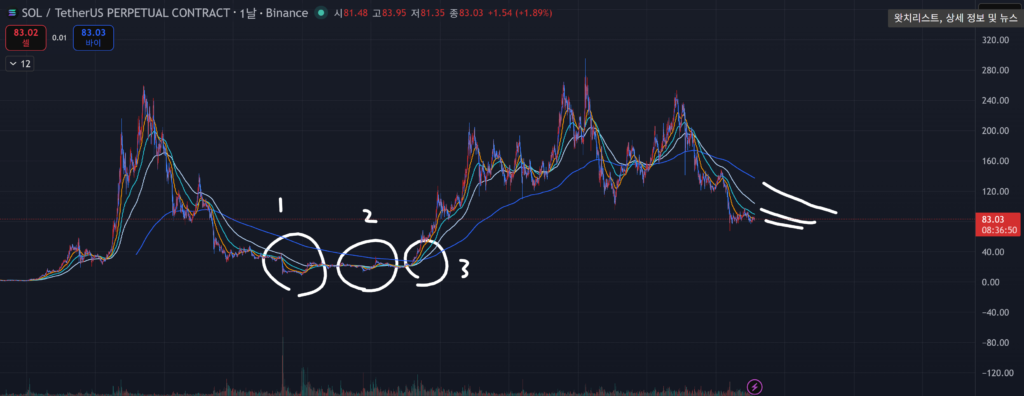
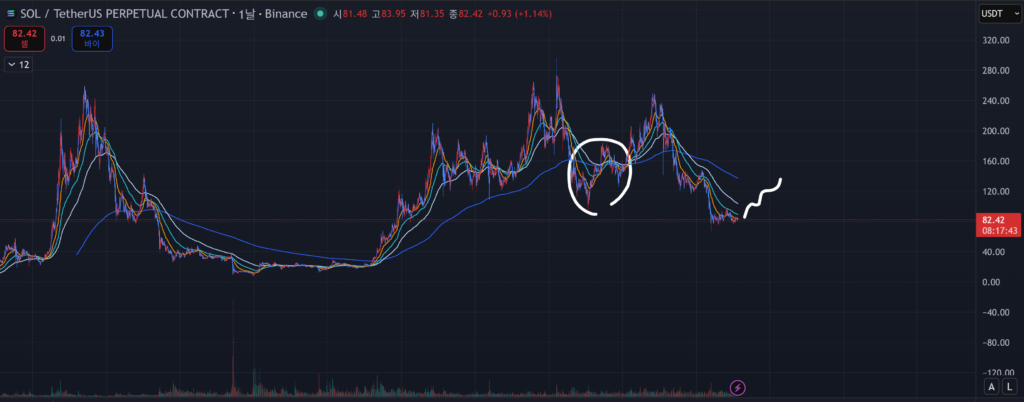
This is the third past pattern There’s a possibility of repeating the rescue for 22 to 23 years
The three circled sections shown in the third chart are key.If you look at the first and second circles, you’ll notice a surge after the plunge, eventful movements (news, market overheating), and an extreme increase in volatility. The characteristic of this section is that both “revenue or large loss” are possible risk sections.
And if you look at the third circle, you can see that it’s the most important.
With the horizontal direction, the horizontal line is organized
Gradually form a regular arrangement.
The characteristic of this section is that it’s a preparatory stage before the start of the real climb, and you can see that it’s a place where only the waiting person eats.
This is the fourth chart point.
There is a possibility of sudden mini fire. In the middle, there is a section that ignores this horizon and surges.
The reason why this is important is that the market always says, “We don’t just move as expected A sudden short rally occurs once in a while.
In other words, even if there is a downward trend right now, a short upward opportunity can come at any time. You’ll have to be prepared for that.
key strategy arrangement-
Let me tell you the most important conclusion on the chart right now.
1 – You can’t just go all-in.
It’s still on the decline and there’s no end signal yet. Until this horizon convergence, it can be seen that there is a risk.
2 – It appears to be a split buyout section.
The current section is “Gathering up a little bit”
It’s safer than trying to timing it and missing it.
3 – Waiting is the key.
It could be a month or two
It can take up to a year at the longest.
The real fireplace is seen as “after the completion of the Moving Average Line Arrangement
4 – We also need to prepare a short-term response.
Mini bullion is a short-term profit opportunity and short strategies can also be considered at the high point after one to two months of mini bullion
In other words, it’s a market that needs to respond to both long-term and short-term.
conclusion
In short, Solana is
“It looks cheap, but it’s not over yet”
Possibly near the floor
However, it is not yet an upward trend shift.
So the important thing is not to be impatient, but to respond by waiting with a split approach.