

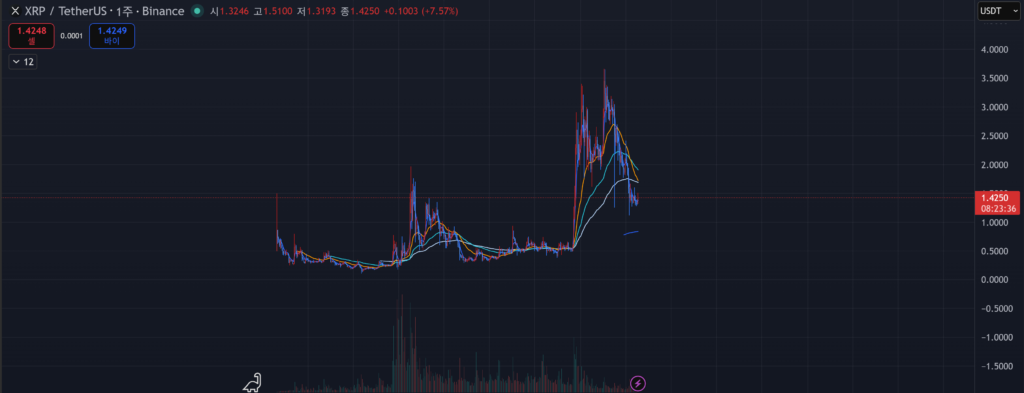
The chart you are currently viewing is the weekly chart of Ripple.
The price on the chart for April 20, 2026 is $1.40
It is a clear downward trend.
I think there are probably many people who have been bitten.
However, since it is the third leader, I will try to predict the flow with at least a little hope.
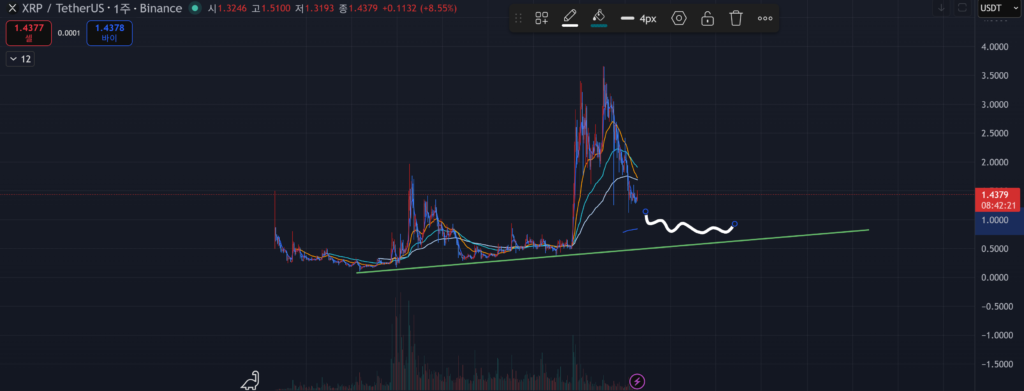
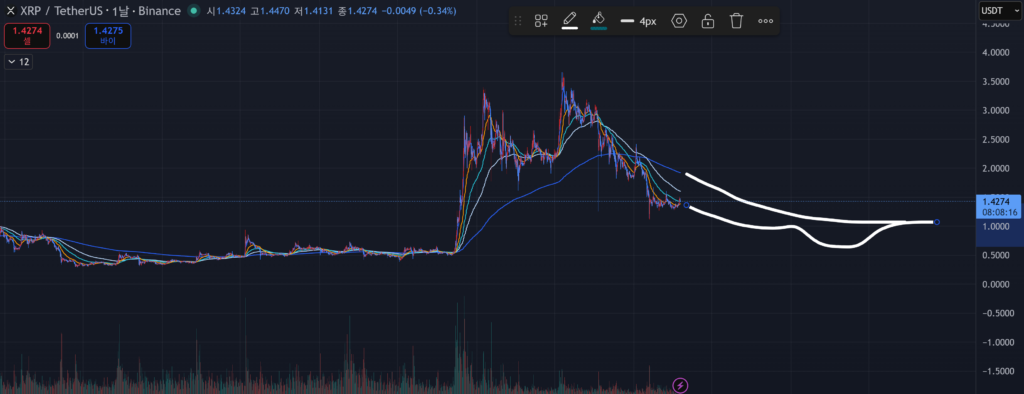
This is the first route, and we can expect a pattern of downward movement followed by sideways consolidation. If the first scenario unfolds, we will face a very boring and tedious sideways market.
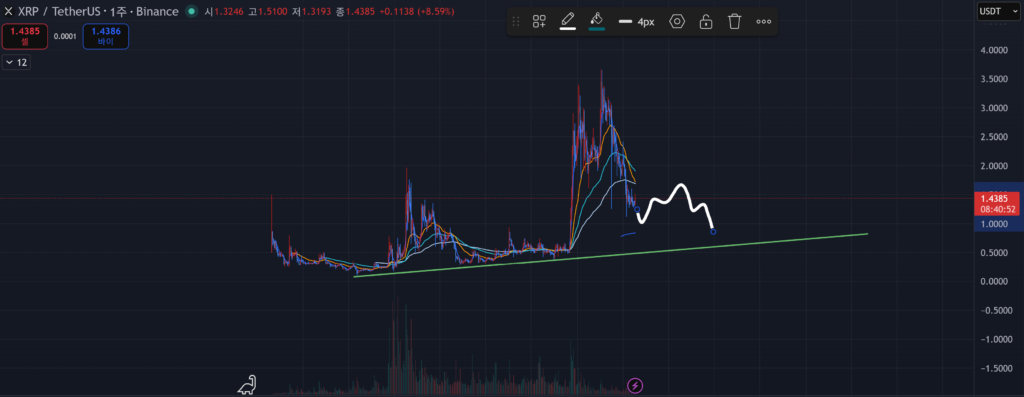
This is the second forecast chart. This scenario depicts a slight rebound followed by a decline. In this case, a weak bull market is expected to occur, albeit briefly.
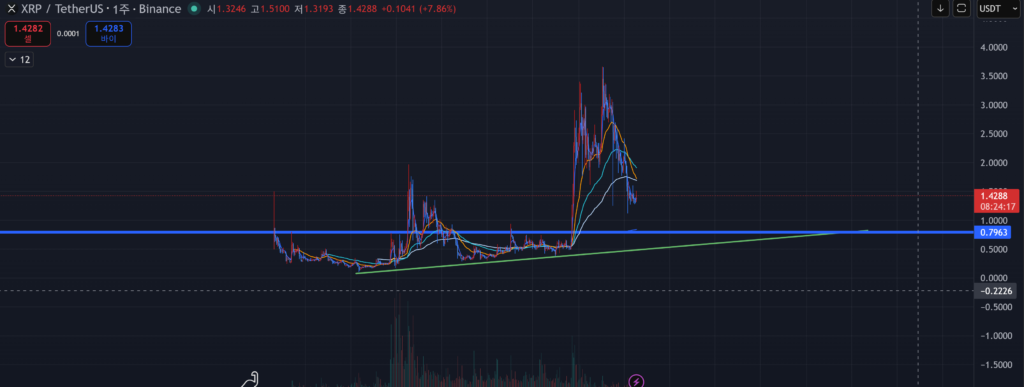
For the third one, although I couldn’t draw the trend, I drew a support line below. Of course, it is short-term, but we can observe movement after it receives support in that zone.
Next, let’s take a look at the daily chart.
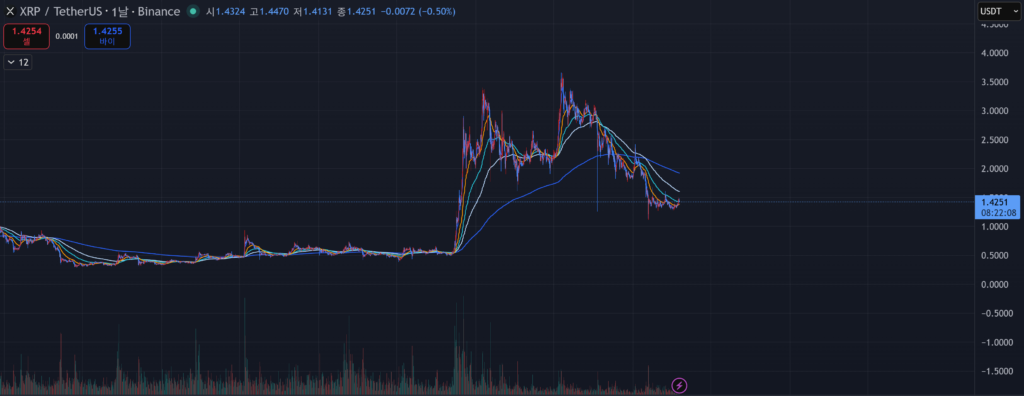
I predicted the moving average lines by drawing a parallel to the previous bear market; it won’t break through the moving averages immediately and easily, but it is possible that it might hit them at least once before falling.
Considering the bending angle and trend of Ripple’s moving averages, it may be difficult to experience an immediate major rally.
Predicting trends can be very tedious and difficult, so you may have to wait up to 1-2 years or observe for a long period of time.
We have to wait and see for the Ripple chart section